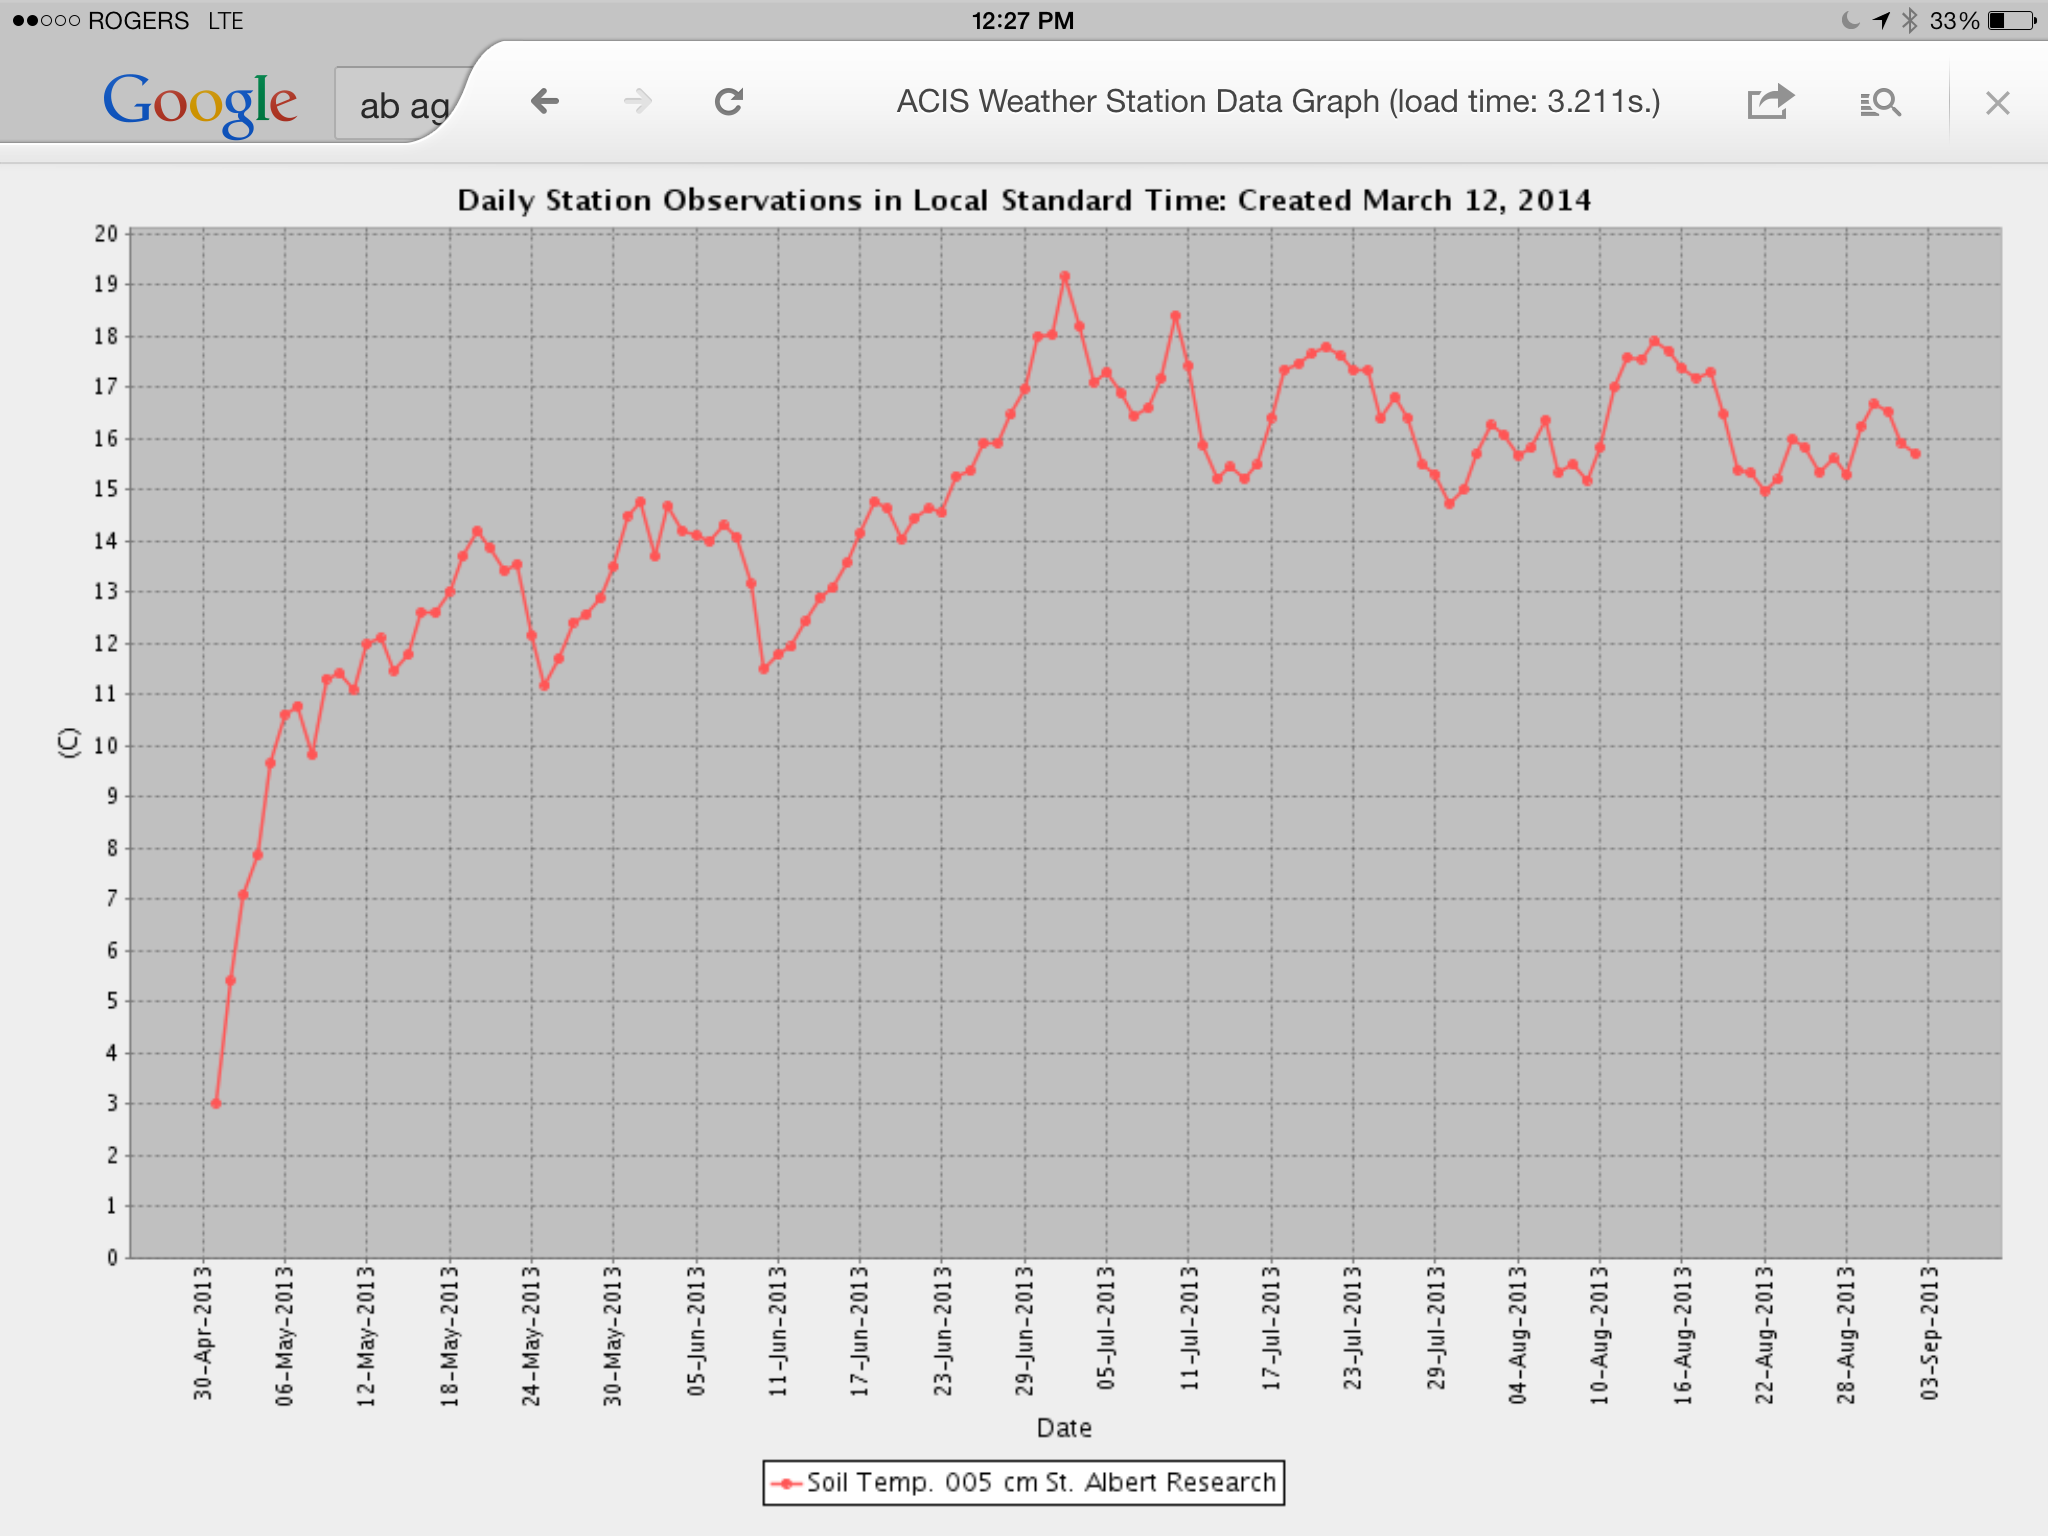
Here is my soil temperature graph taken in the top 2 inches from May 1st, 2013 to Sept 1, 2013.
http://beyondagronomy.com//cmsFiles/documents/document533113fe3df8b.PNG
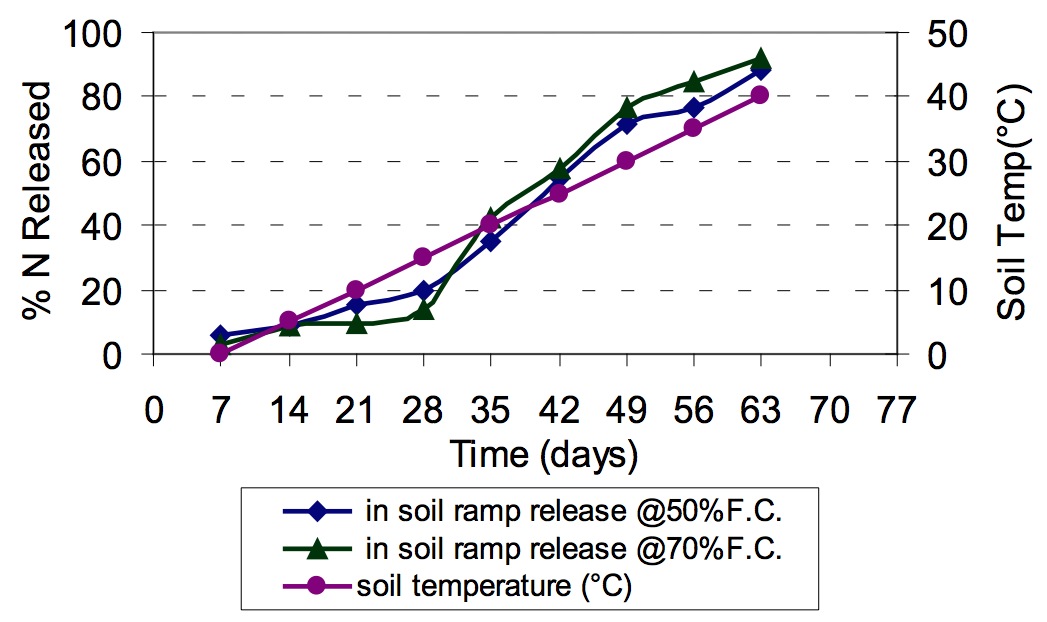
Here is the nitrogen release curve with ESN.
http://beyondagronomy.com//cmsFiles/documents/document5331146f59d37.jpg
Kirsten - 2022-11-09
Hi Steve. I'm a cropping systems modeller with CSIRO in Australia and modelling release from controlled-release fertilisers in cropping systems context. Not sure if this comment function of the website still works, but was wondering with your figure of soil temperature and ESN release posted back on March 24, 2014 belonged together - i.e. from the same experiment? The release graph has a temperature line which is increasing linearly from 0 to 40 and the release is for two moisture contents. Was that release under field or lab conditions? Did temperature indeed increase linearly, or was it meant to indicate something else?


