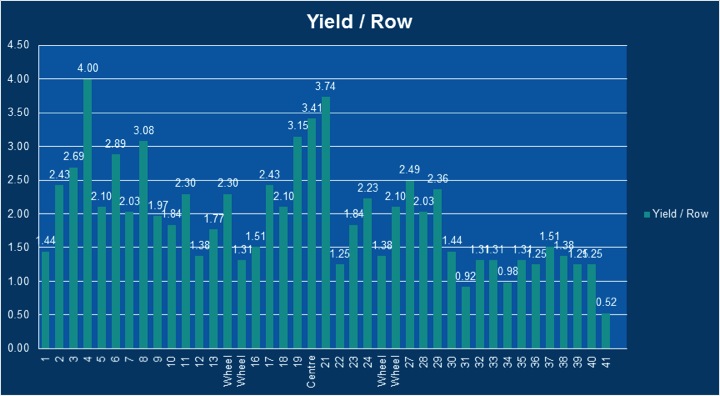
This graph outlines the yields per row across 41 shanks of an air drill. Half of the air drill was running along a headland with little wheel traffic while the inside half of the drill was running on soil with increased wheel traffic.
See graph: http://beyondagronomy.com//cmsFiles/documents/document5316a65749871.jpg
Rows 1 - 24 (excluding the wheeled rows) averaged 2.3 t/ha and returned a Gross Margin of $132/ha.
The wheel tracks averaged 1.77 t/ha and returned a GM of $47/ha or $87/ha less than the outside rows.
Rows 27 - 41 (where you could assume there was a history of random traffic) averaged 1.35 t/ha or -$20/ha GM or a net loss of revenue of $152/ha compared to runs 1-24.


